Points, polygons, and lines … and rasters - OH MY!
A point or a vector of points are simply geographic coordinates, like a series or one x-y pair. They have no dimensions, so sometimes if you want to find something near a point you will need to draw a buffer around it so that it has some area. Examples of point data in GIS are locations of trees in a city, locations where you stopped on a hike, or locations of defibrillators in a building.
Polygons are a series of points with area in the middle, think of lakes or soccer fields. Sometimes polygons can have holes or spaces in them. An example is a lake with islands in the middle of it.
Lines are a series of points with no area between them. Examples are roads and railways.
Each of these types of GIS shapes can be stored as multiples, such as poly-lines (example a multi-lane highway), or multipolygons (example, Tribal Land that is not contiguous).
Rasters
Rasters are continuous data, think of color spectra or the range of moods you may have from very angry to quite happy…you are rarely just one of these and there are infinite gradations depending on how annoying other drivers are or if you got the perfect birthday cake.
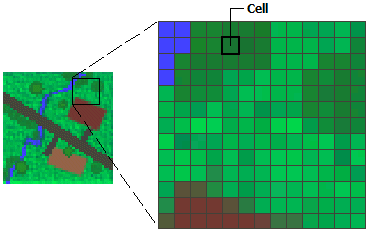
Rasters can also be aerial photography or remote sensing imagery. The colors or variations in the cells of information represent certain themes like air pollution concentrations or green canopy cover. Rasters are stored in a matrix of cells, like a table and the size of the cell represents the resolution of the information. If the cell is 50 m x 50 m, then there will be no additional information variation within that size of a cell (i.e. the temperature depicted in that whole cell will be the same throughout the cell).

