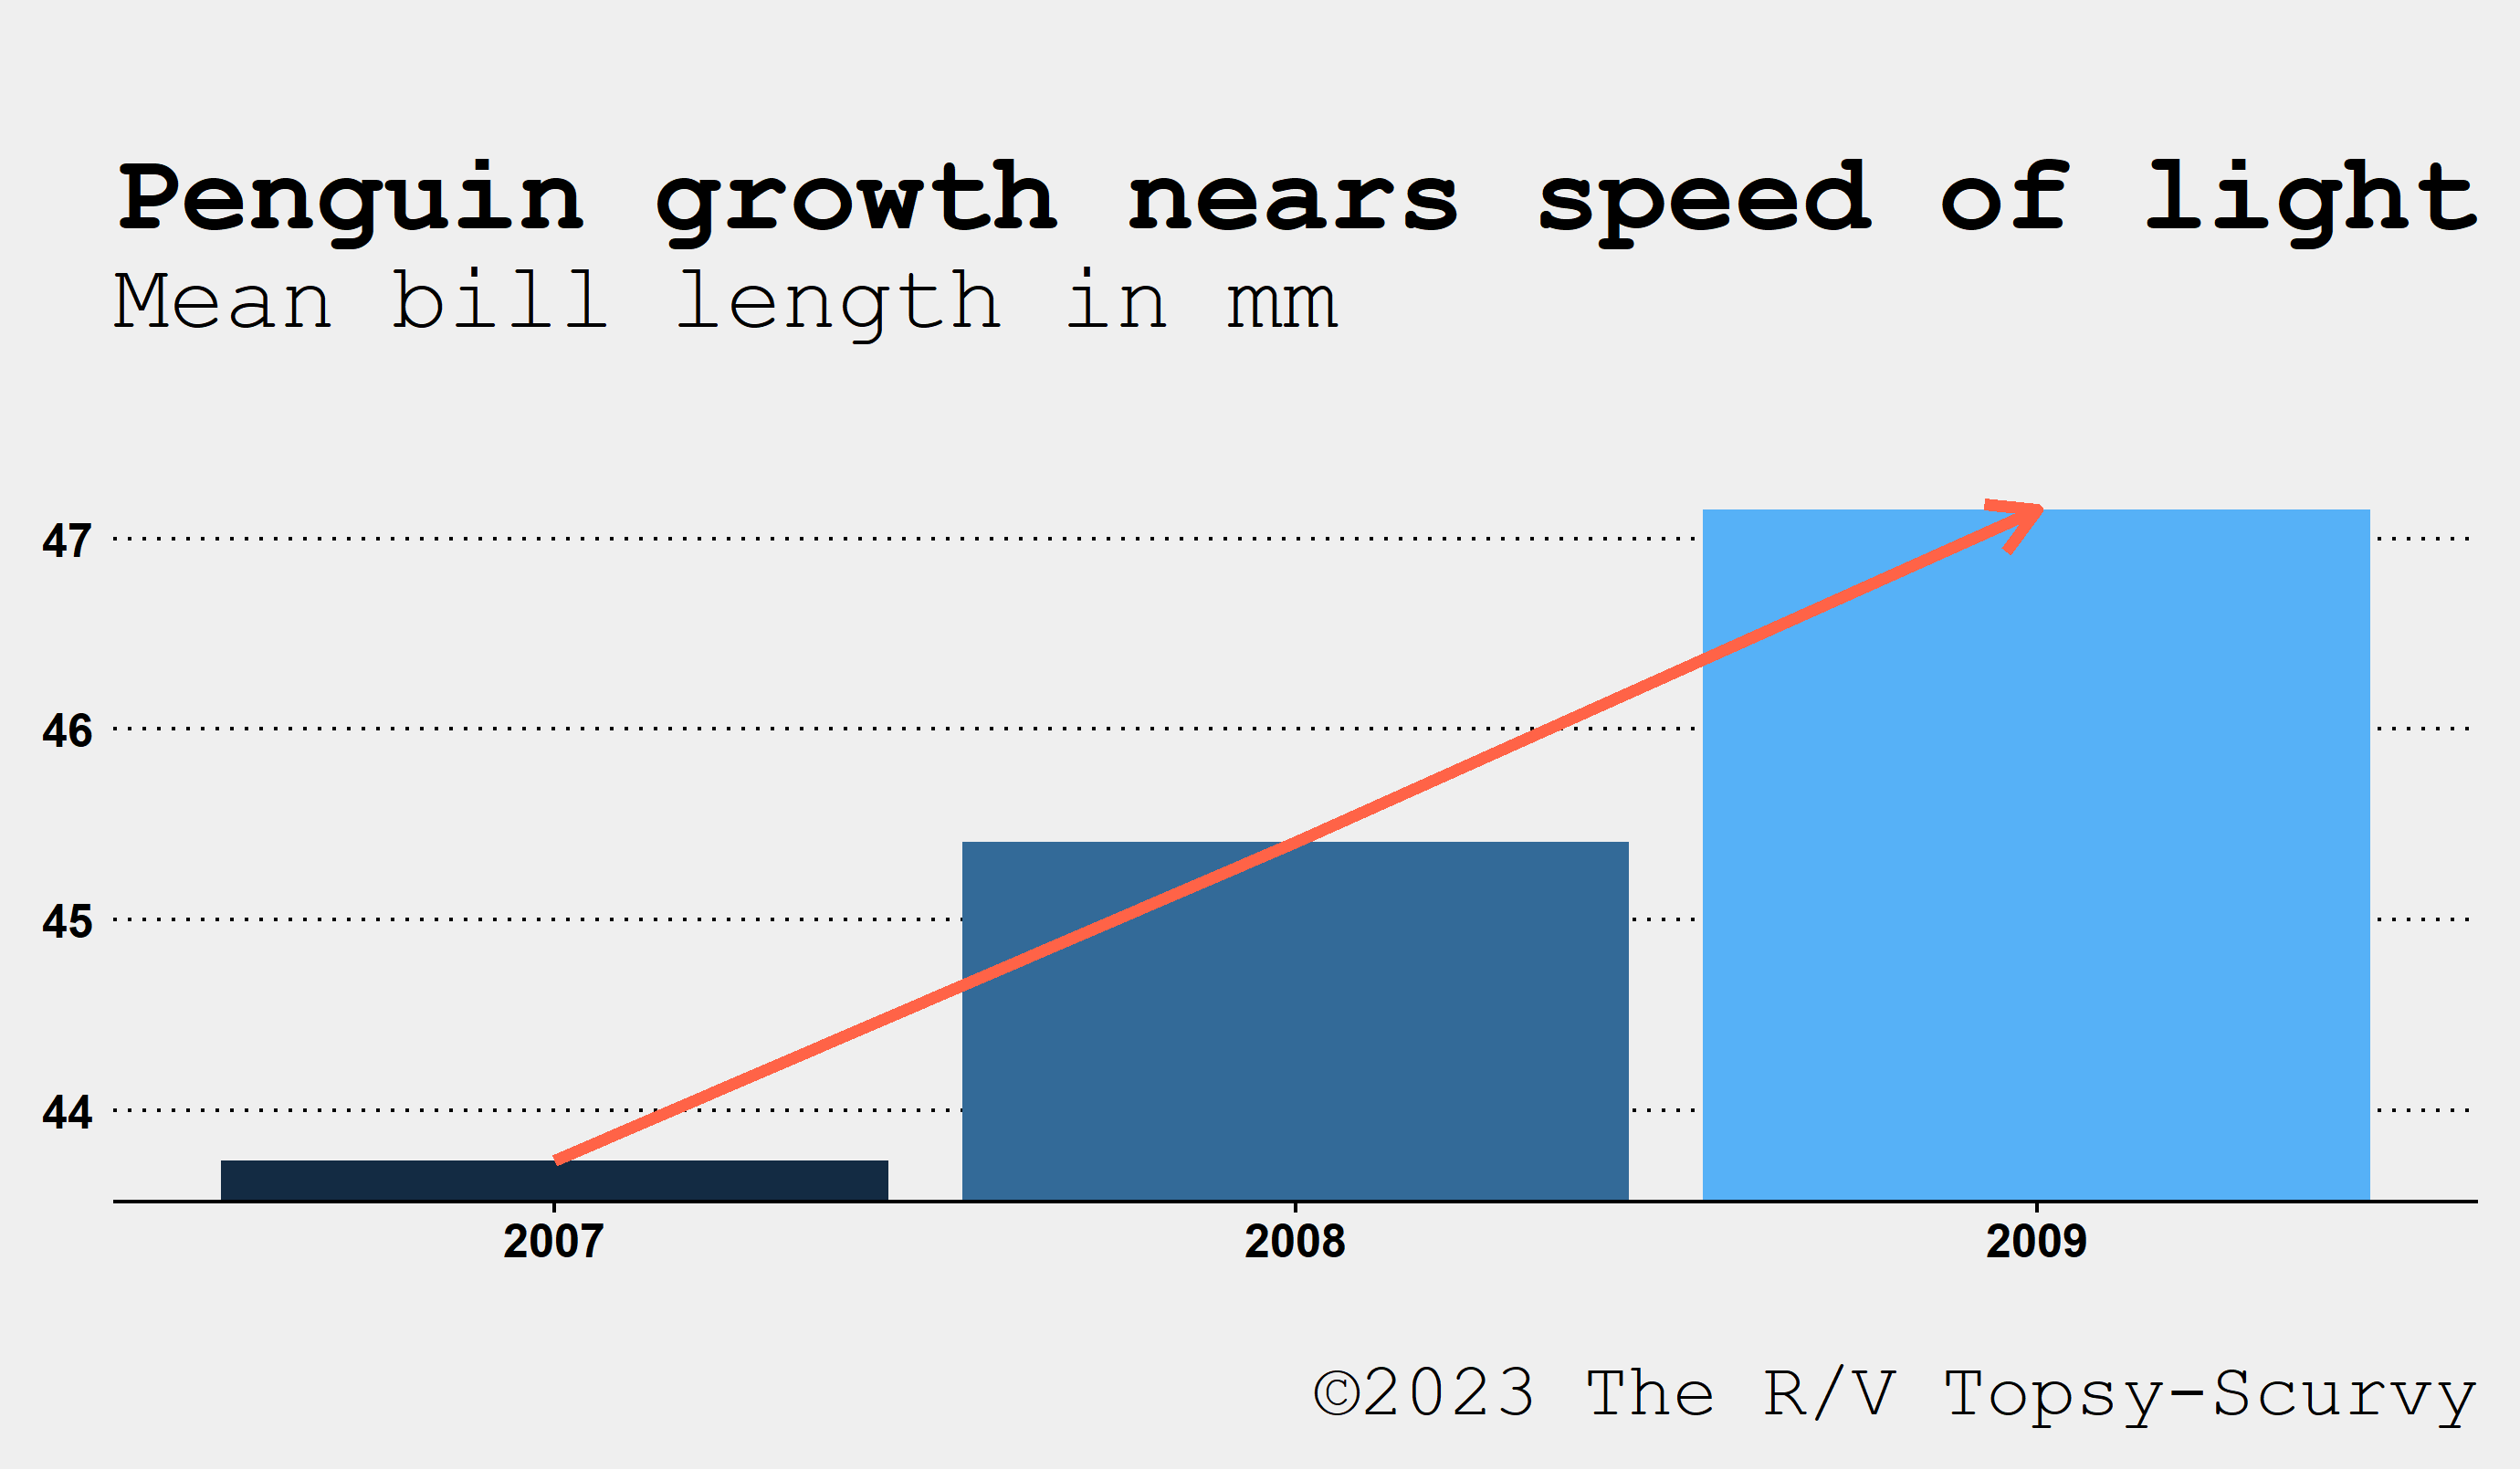
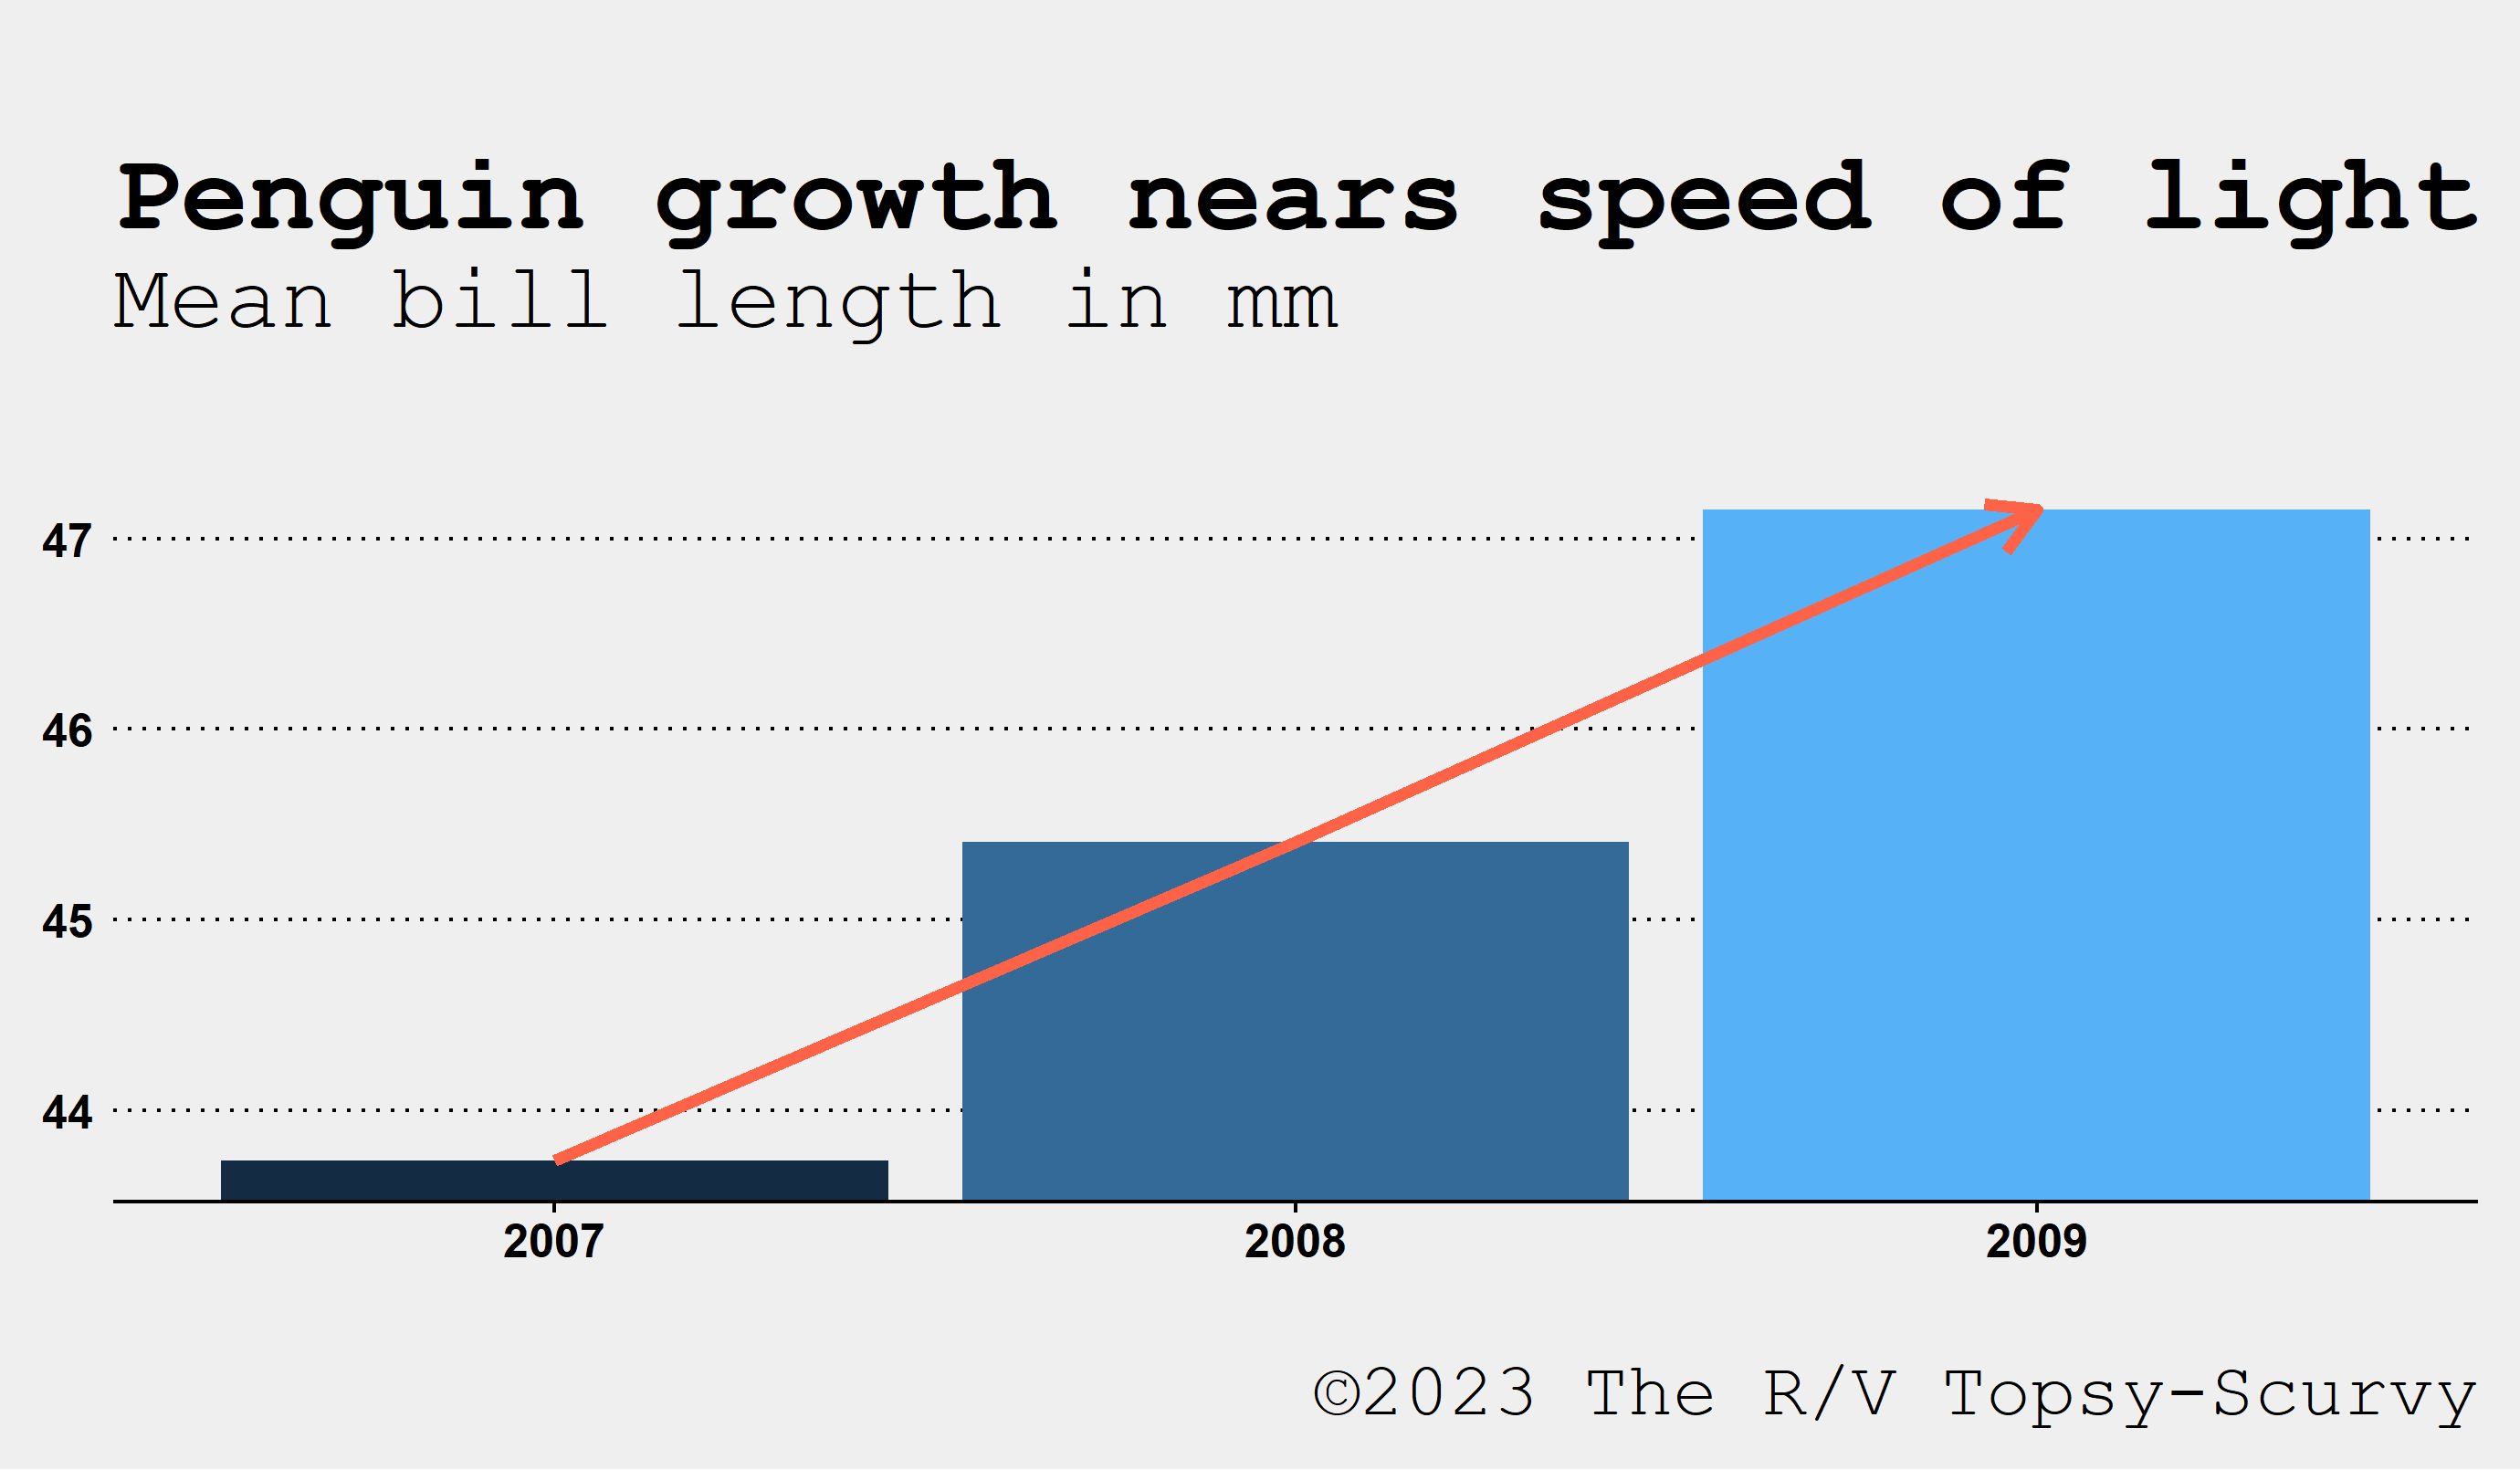
class: middle, center, inverse .shift-up[ ## .smaller[PLOTS] # .bigger[.bigger[.teal[FOR REAL]]] ] <style> .teal h3 {font-weight: bold;} .bigchart {margin-top: -10px; margin-left: -5%; width: 110%;} .wider {width: 107%;} img {max-width: 120%; width: 100%;} .clear {clear:both;} h2, h3 {color: black;} .pull-right img {width: 139%; max-width: 139%; margin-left: -38px; margin-top: -20px;} .pull-left .remark-code-line {font-size: 1.49rem;} .pull-up {margin-top: -28px;} .small-font {font-size: 1.5rem;} .small-font .remark-code-line {font-size: 1.5rem;} .med-font .remark-code-line {font-size: 1.7rem;} .shift-up {margin-top: -20px;} .shift-left {margin-left: -100px;} .small-shift-left {margin-left: -60px;} .shift-right {margin-left: 180px;} .shift-down {padding-top: 12px;} .remark-slide table {width: 108%; font-size: 1.4rem;} .small-table table {width: 39%;} .remark-code {width: 104%;} .remark-code-line {font-size: 1.75rem; line-height: 1.37;} </style> -- <div class="ticker-container"> <div class="ticker-wrapper"> <div class="ticker-transition"> <div class="ticker-item">...BREAKING NEWS...</div> <div class="ticker-item">..Penguins at it again...</div> <div class="ticker-item">..BREAKING NEWS...</div> <div class="ticker-item">..So BIG growth rate expected to exceed...</div> <div class="ticker-item">...BREAKING NEWS...</div> <div class="ticker-item">..Penguins growing and growing...</div> <div class="ticker-item">...BREAKING NEWS....</div> </div> </div> </div> --- class: middle, center, inverse exclude: true ## .smaller[GGPLOTS] # .bigger[.bigger[.teal[FOR REAL]]] <h1 style="text-wrap: nowrap; margin-left: -153px; position: absolute;"> S....BREAKING NEWS....BREAKING NEWS....BREAKI...</h1> --- class: animated infinite pulse <img src="../images/breaking_news.jpg" style="width: 130%; max-width: 135%; margin-left: -136px; margin-top: -68px;"> --- <img src="https://github.com/tidy-MN/R-camp-slides/blob/main/slides/images/news_pengzilla.gif?raw=true" style="width: 135%; max-width: 135%; margin-left: -165px; margin-top: -64px;"> --- class: middle, center > .shift-left[# .bigger[“]The penguins are growing....bigger[”]] > .small-shift-left[### .darkgray[.small[*- The R/V Topsy-Scurvy*]]] <img src="../images/penguin_gray.png" style="width: 110px; position: absolute; bottom: 183px; left: 82px;"> <img src="../images/penguin_gray.png" style="width: 1260px; position: absolute; top: -80px; right: -440px;"> --- class: middle, center, gray-bg .shift-up[ <!-- --> ] --- .shift-up[ ### > .bluecode[`growth_plot.R`] ] ```r library(tidyverse) library(ggthemes) # News plot ggplot(mean_bill_lengths, aes(x = year, y = avg_bill_length)) + geom_col(aes(fill = year), show.legend = FALSE) + geom_line(linewidth = 2, color = "tomato", arrow = arrow()) + coord_cartesian(ylim = c(43.7, 47.2)) + labs(title = "Penguin growth nears speed of light", subtitle = "Mean bill length in mm\n", caption = "©2023 The R/V Topsy-Scurvy") + theme_wsj(color = "gray") ``` --- .shift-up[ ### Y-axis limits ] ```r library(tidyverse) library(ggthemes) # News plot ggplot(mean_bill_lengths, aes(x = year, y = avg_bill_length)) + geom_col(aes(fill = year), show.legend = FALSE) + geom_line(linewidth = 2, color = "tomato", arrow = arrow()) + * coord_cartesian(ylim = c(43.7, 47.2)) + labs(title = "Penguin growth nears speed of light", subtitle = "Mean bill length in mm\n", caption = "©2023 The R/V Topsy-Scurvy") + theme_wsj(color = "gray") ``` --- .shift-up[ ### Y-axis limits ] ```r library(tidyverse) library(ggthemes) # News plot ggplot(mean_bill_lengths, aes(x = year, y = avg_bill_length)) + geom_col(aes(fill = year), show.legend = FALSE) + geom_line(linewidth = 2, color = "tomato", arrow = arrow()) + coord_cartesian(ylim = c(`0`, 47.2)) + labs(title = "Penguin growth nears speed of light", subtitle = "Mean bill length in mm\n", caption = "©2023 The R/V Topsy-Scurvy") + theme_wsj(color = "gray") ``` --- .shift-up[ ### With set Y-axis limit ] <!-- --> --- .shift-up[ ### .teal[Start Y-axis at ZERO] ] <!-- --> --- .shift-up[ ### geom_line **->** ] ```r library(tidyverse) library(ggthemes) # News plot ggplot(mean_bill_lengths, aes(x = year, y = avg_bill_length)) + geom_col(aes(fill = year), show.legend = FALSE) + * geom_line(linewidth = 2, color = "tomato", arrow = arrow()) + coord_cartesian(ylim = c(0, 47.2)) + labs(title = "Penguin growth nears speed of light", subtitle = "Mean bill length in mm\n", caption = "©2023 The R/V Topsy-Scurvy") + theme_wsj(color = "gray") ``` --- .shift-up[ ### geom_line **->** ] ```r library(tidyverse) library(ggthemes) # News plot ggplot(mean_bill_lengths, aes(x = year, y = avg_bill_length)) + geom_col(aes(fill = year), show.legend = FALSE) + * coord_cartesian(ylim = c(0, 47.2)) + labs(title = "Penguin growth nears speed of light", subtitle = "Mean bill length in mm\n", caption = "©2023 The R/V Topsy-Scurvy") + theme_wsj(color = "gray") ``` --- .shift-up[ ### .teal[Hold the line] ] <!-- --> --- class: inverse, middle, center # .bigger[.blue[labs( )]] --- .shift-up[ ### Title and labels ] ```r library(tidyverse) library(ggthemes) # News plot ggplot(mean_bill_lengths, aes(x = year, y = avg_bill_length)) + geom_col(aes(fill = year), show.legend = FALSE) + coord_cartesian(ylim = c(0, 47.2)) + * labs(title = "Penguin growth nears speed of light", * subtitle = "Mean bill length in mm\n", * caption = "©2023 The R/V Topsy-Scurvy") + theme_wsj(color = "gray") ``` --- .shift-up[ ### Title and labels ] ```r library(tidyverse) library(ggthemes) # News plot ggplot(mean_bill_lengths, aes(x = year, y = avg_bill_length)) + geom_col(aes(fill = year), show.legend = FALSE) + coord_cartesian(ylim = c(0, 47.2)) + * labs(title = "Penguin bill lengths by year", subtitle = "Mean bill length in mm\n", caption = "©2023 The R/V Topsy-Scurvy") + theme_wsj(color = "gray") ``` --- .shift-up[ ### Title and labels ] ```r library(tidyverse) library(ggthemes) # News plot ggplot(mean_bill_lengths, aes(x = year, y = avg_bill_length)) + geom_col(aes(fill = year), show.legend = FALSE) + coord_cartesian(ylim = c(0, 47.2)) + labs(title = "Penguin bill lengths by year", * subtitle = "Mean bill length in millimeters (mm)\n", caption = "©2023 The R/V Topsy-Scurvy") + theme_wsj(color = "gray") ``` --- .shift-up[ ### Title and labels ] ```r library(tidyverse) library(ggthemes) # News plot ggplot(mean_bill_lengths, aes(x = year, y = avg_bill_length)) + geom_col(aes(fill = year), show.legend = FALSE) + coord_cartesian(ylim = c(0, 47.2)) + labs(title = "Penguin bill lengths by year", subtitle = "Mean bill length in millimeters (mm)\n", * caption = "©2023 The R/V Topsy-Scurvy") + theme_wsj(color = "gray") ``` --- .shift-up[ ### Title and labels ] ```r library(tidyverse) library(ggthemes) # News plot ggplot(mean_bill_lengths, aes(x = year, y = avg_bill_length)) + geom_col(aes(fill = year), show.legend = FALSE) + coord_cartesian(ylim = c(0, 47.2)) + labs(title = "Penguin bill lengths by year", subtitle = "Mean bill length in millimeters (mm)\n", caption = "©2023 The R/V Topsy-Scurvy", * x = "Year") + theme_wsj(color = "gray") ``` --- .shift-up[ ### Title and labels ] ```r library(tidyverse) library(ggthemes) # News plot ggplot(mean_bill_lengths, aes(x = year, y = avg_bill_length)) + geom_col(aes(fill = year), show.legend = FALSE) + coord_cartesian(ylim = c(0, 47.2)) + labs(title = "Penguin bill lengths by year", subtitle = "Mean bill length in millimeters (mm)\n", caption = "©2023 The R/V Topsy-Scurvy", x = "Year", * y = "(mm)") + theme_wsj(color = "gray") ``` --- .shift-up[ ### .teal[With less ~~EXAGGERATION~~] ] <!-- --> --- .shift-up[ ### Color changes ] ```r library(tidyverse) library(ggthemes) # News plot ggplot(mean_bill_lengths, aes(x = year, y = avg_bill_length)) + * geom_col(aes(fill = year), show.legend = FALSE) + coord_cartesian(ylim = c(0, 47.2)) + labs(title = "\nPenguin bill lengths by year", subtitle = "Mean bill length in millimeters (mm)\n", caption = "©2023 The R/V Topsy-Scurvy", x = "Year", y = "(mm)") + theme_wsj(base_size = 16, color = "gray") ``` --- .shift-up[ ### Color changes ] ```r library(tidyverse) library(ggthemes) # News plot ggplot(mean_bill_lengths, aes(x = year, y = avg_bill_length)) + * geom_col(fill = "#003865") + coord_cartesian(ylim = c(0, 47.2)) + labs(title = "\nPenguin bill lengths by year", subtitle = "Mean bill length in millimeters (mm)\n", caption = "©2023 The R/V Topsy-Scurvy", x = "Year", y = "(mm)") + theme_wsj(base_size = 16, color = "gray") ``` --- .shift-up[ ### .teal[Drop distracting color-coding] ] <!-- --> --- class: inverse, middle, center # .bigger[.blue[theme_*( )]] --- class: center .shift-up[ # Built-in .blue[ggplot] themes ] <img src="https://mn-r.netlify.app/images/ggplot_themes.png" style="width: 57%;"> --- .shift-up[ ### ggthemes ] ```r library(tidyverse) *library(ggthemes) # News plot ggplot(mean_bill_lengths, aes(x = year, y = avg_bill_length)) + geom_col(fill = "#003865") + coord_cartesian(ylim = c(0, 47.2)) + labs(title = "Penguin bill lengths by year", subtitle = "Mean bill length in millimeters (mm)\n", caption = "©2023 The R/V Topsy-Scurvy", x = "Year", y = "(mm)") + * theme_wsj(color = "gray") ``` <!-- --> --- .shift-up[ ### ggthemes ] ```r library(tidyverse) library(ggthemes) # News plot ggplot(mean_bill_lengths, aes(x = year, y = avg_bill_length)) + geom_col(fill = "#003865") + coord_cartesian(ylim = c(0, 47.2)) + labs(title = "Penguin bill lengths by year", subtitle = "Mean bill length in millimeters (mm)\n", caption = "©2023 The R/V Topsy-Scurvy", x = "Year", y = "(mm)") + * theme_minimal() ``` <!-- --> --- .shift-up[ ### .teal[Use a theme with axes labels] ] <!-- --> --- class: inverse, middle, center # .big[<i class="fa-solid fa-user-secret"></i>] # .bigger[.blue[Sleuthing time]] --- class: inverse exclude: true ### > .bluecode[`load_RV_penguins.R`] <br> .small-font[ ```r library(tidyverse) # Raw R/V Topsy-Scurvy data url <- "https://tidy-mn.github.io/R-camp-penguins/data/rv_scurvy_penguins.csv" rv_penguins <- read_csv(url) ``` ] --- class: inverse, middle, center exclude: true # .bigger[.blue[facet_wrap( )]] --- class: inverse, middle, center exclude: true # .bigger[.blue[colors and legends]] --- class: inverse, center, middle # <i class="fas fa-carrot" aria-hidden="true"></i> [Back to Videos](https://tidy-mn.github.io/R-camp-penguins/index.html)