1 Dataframe SMASH: Joining tables

Joining monsters
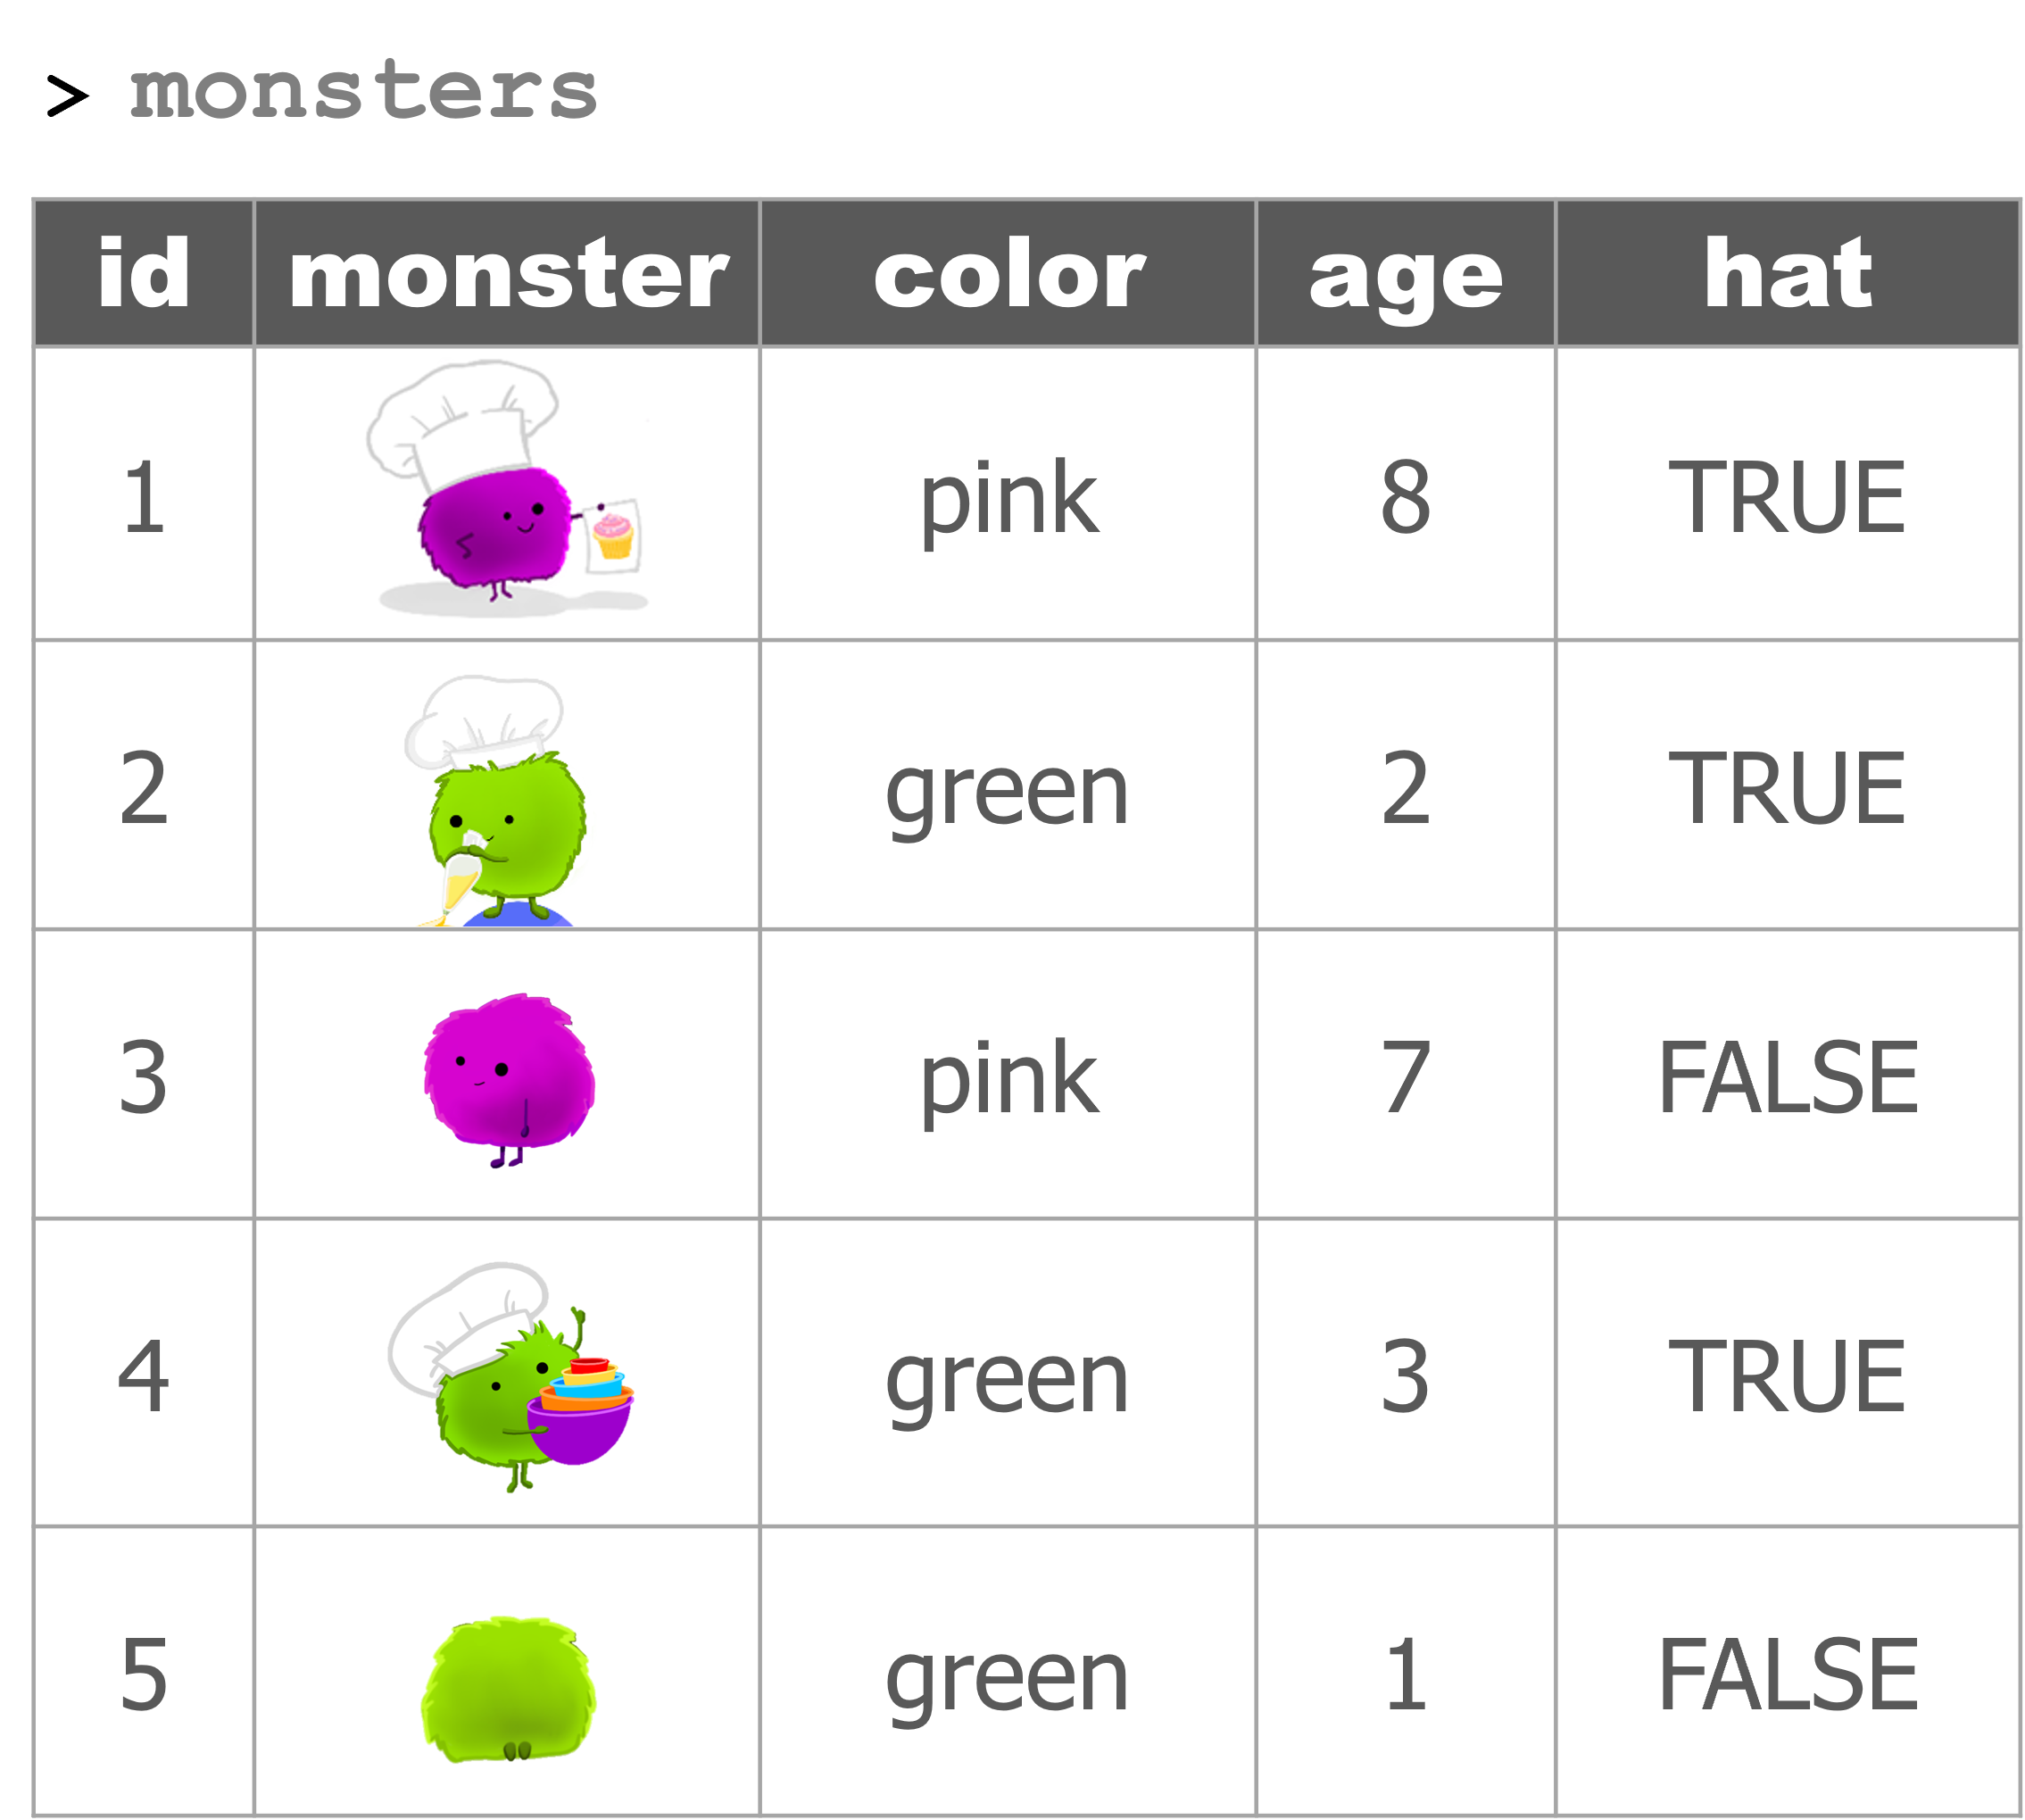

# Create monsters df
monsters <- data.frame(id = 1:5,
color = c("pink", "green", "pink", "green", "green"),
age = c(8,2,7,3,1),
hat = c(T,T,F,T,F) )
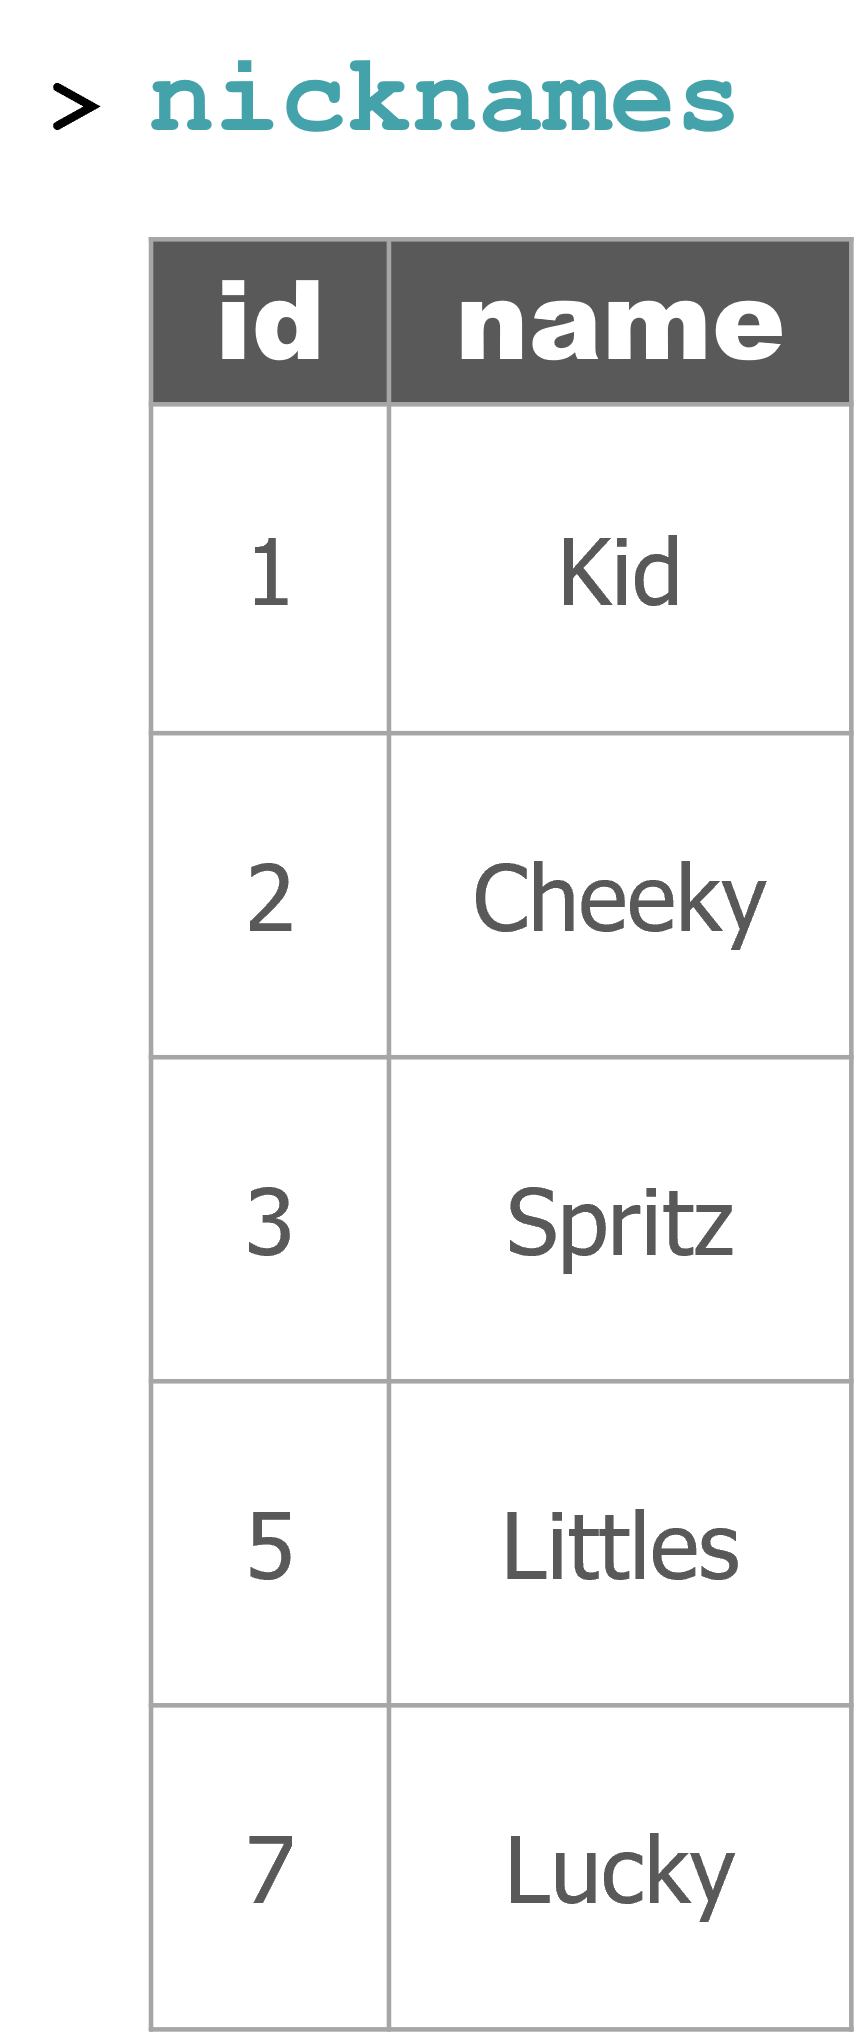
# Create monster nicknames df
nicknames <- data.frame(id = c(1,2,3,5,7),
name = c("Kid", "Cheeky", "Spritz", "Littles", "Lucky"))
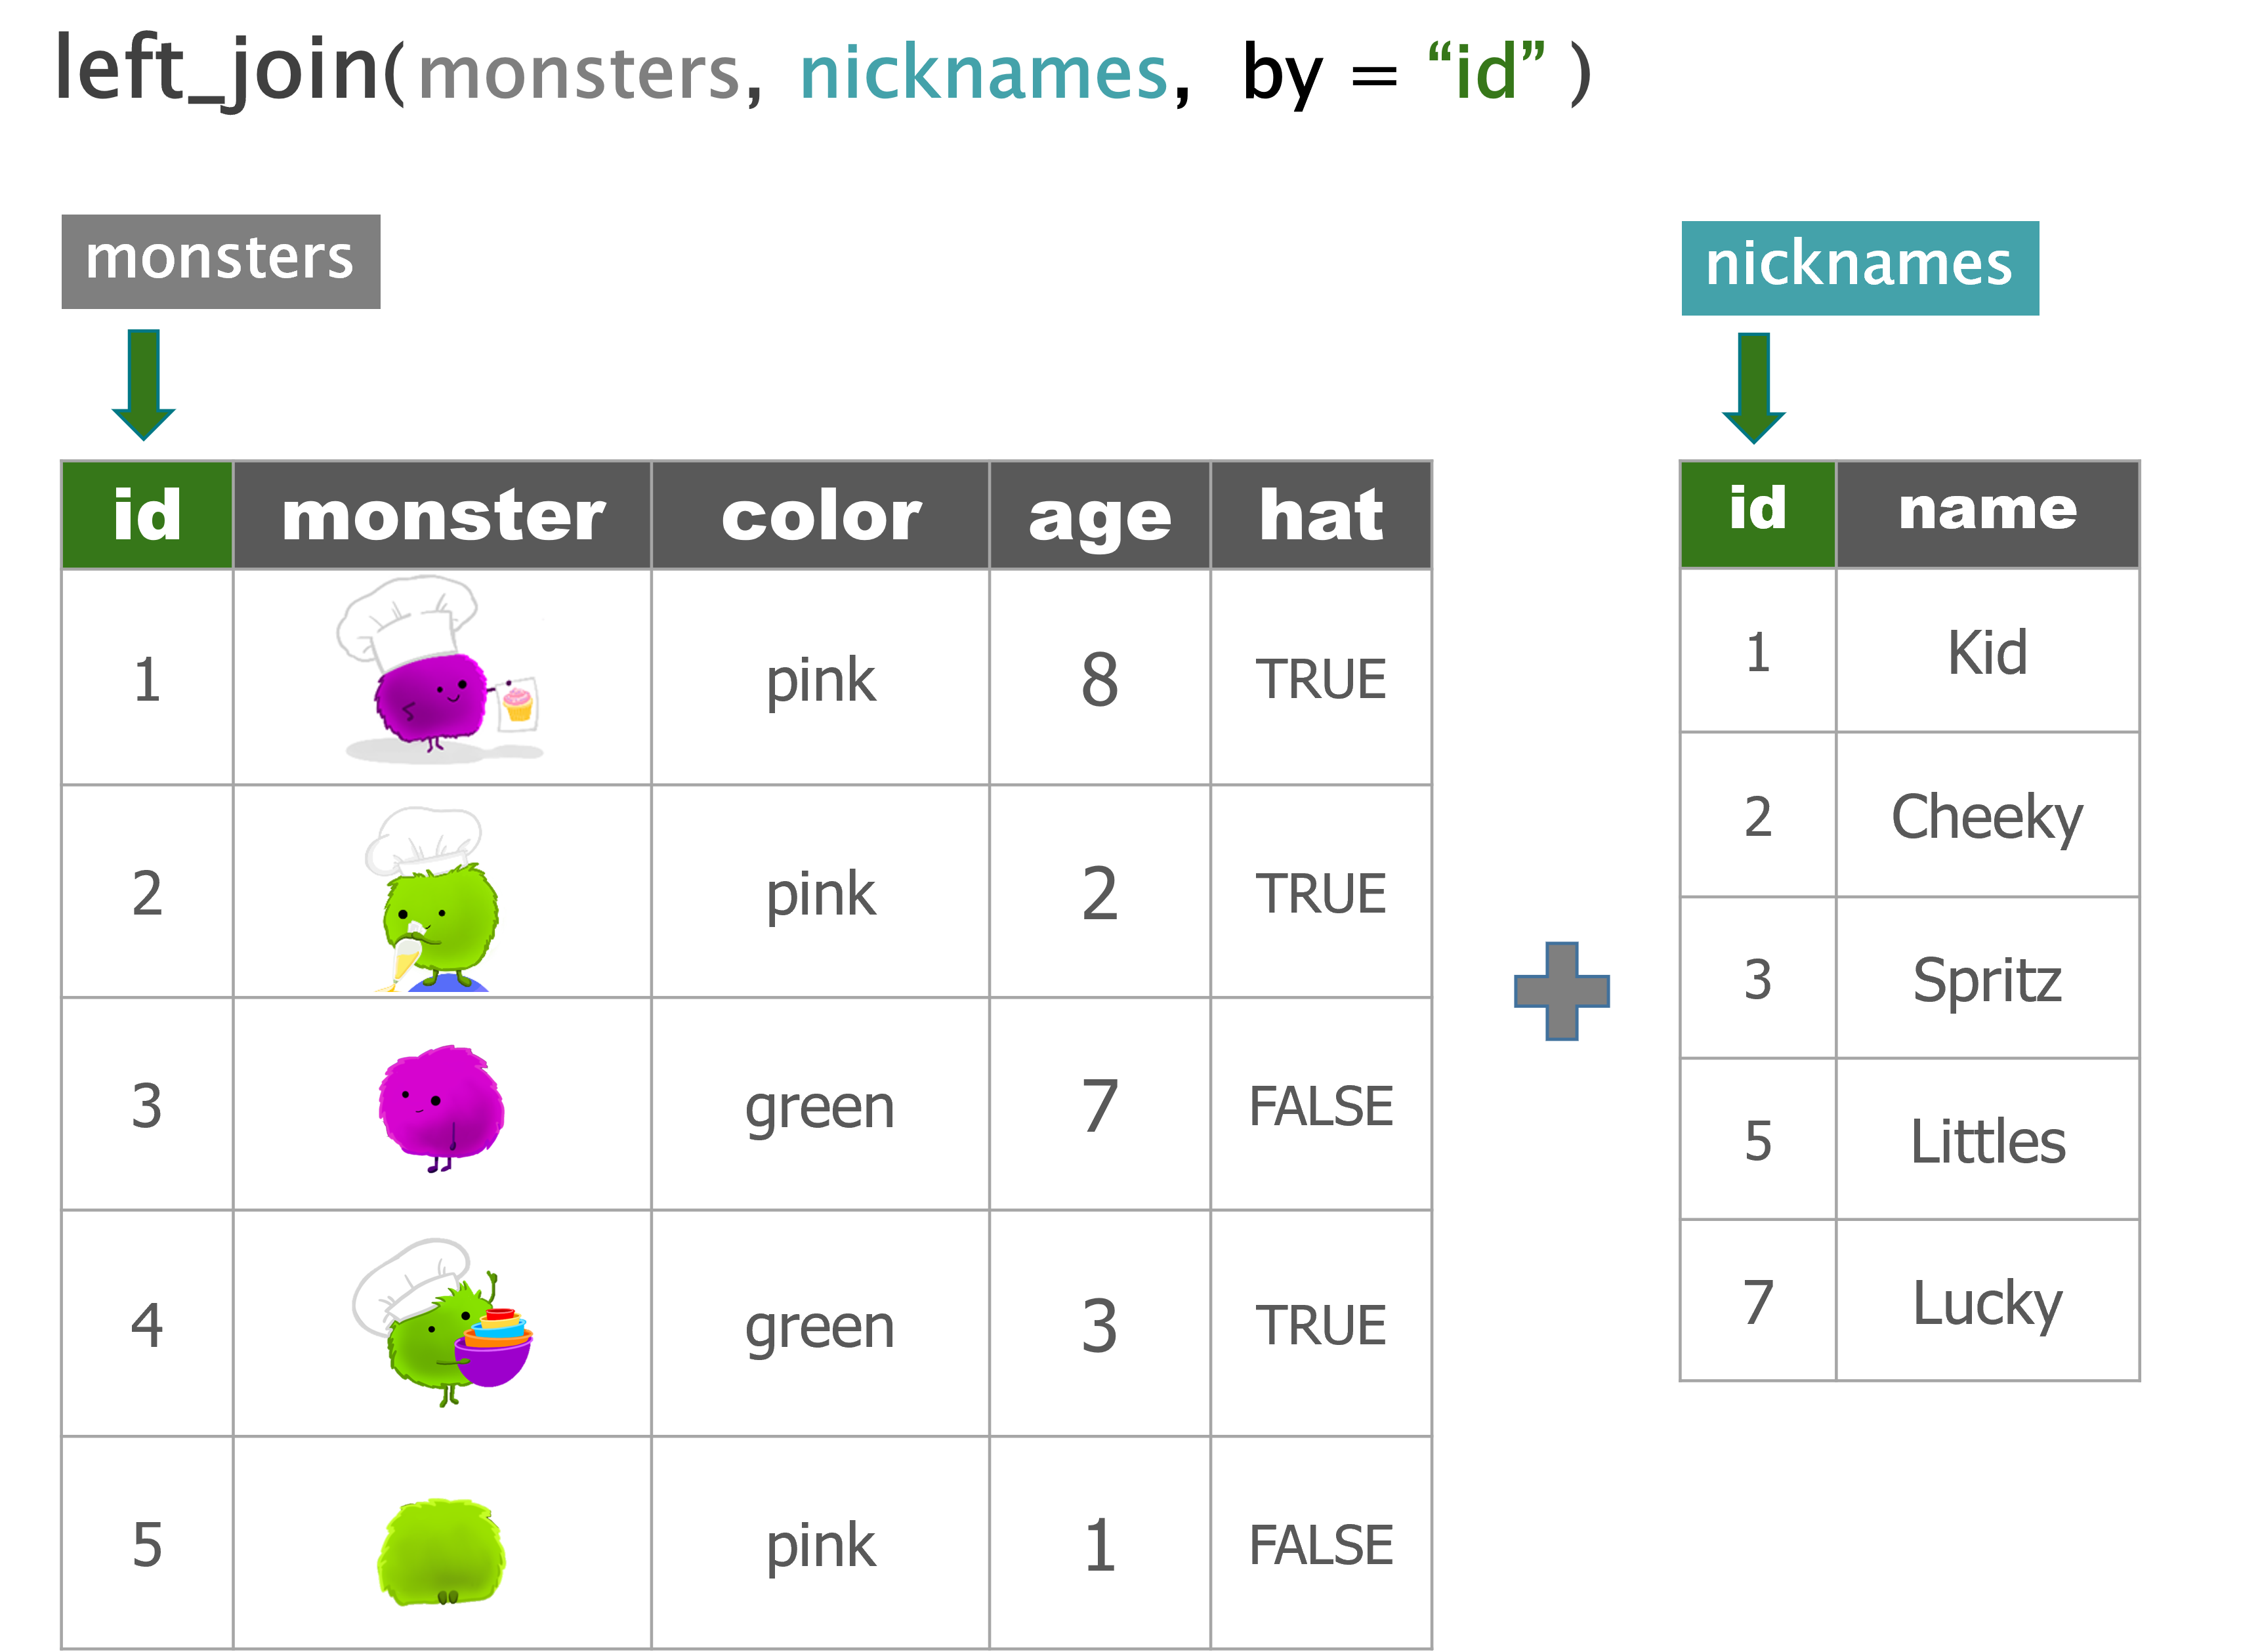
# LEFT_JOIN ----
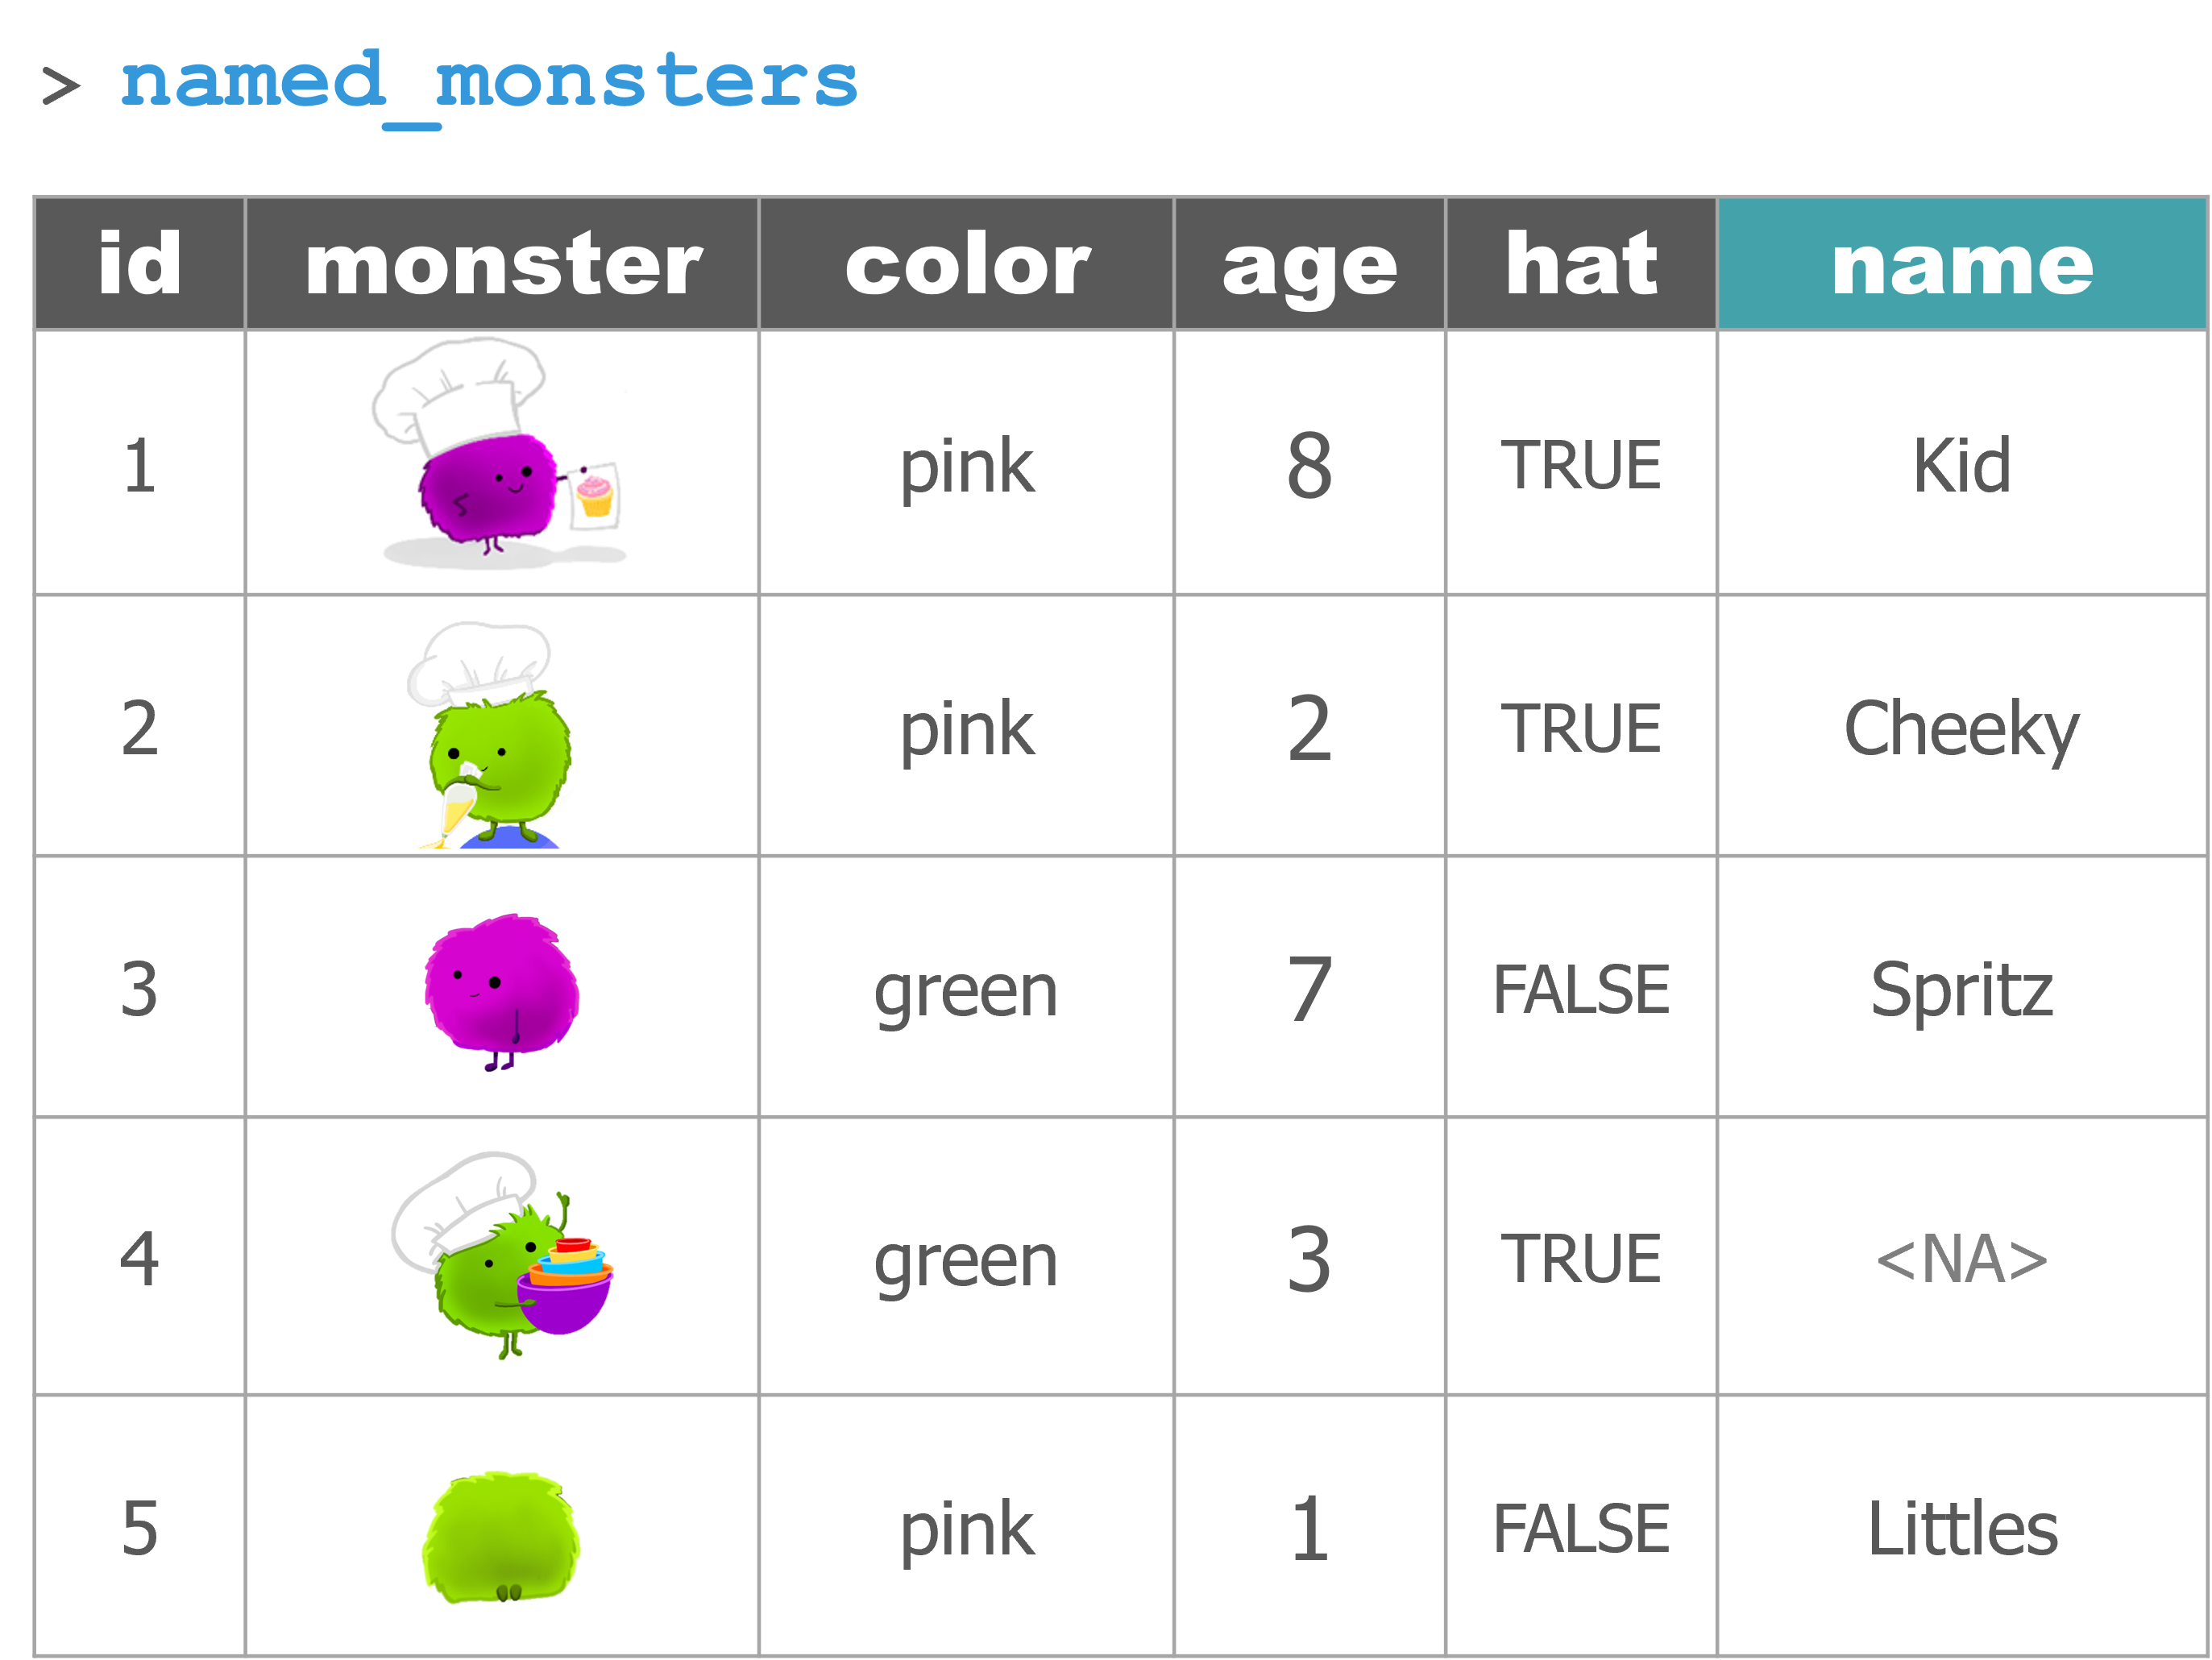
named_monsters <- left_join(monsters, nicknames, by = "id")
named_monsters
# ANTI_JOIN ----
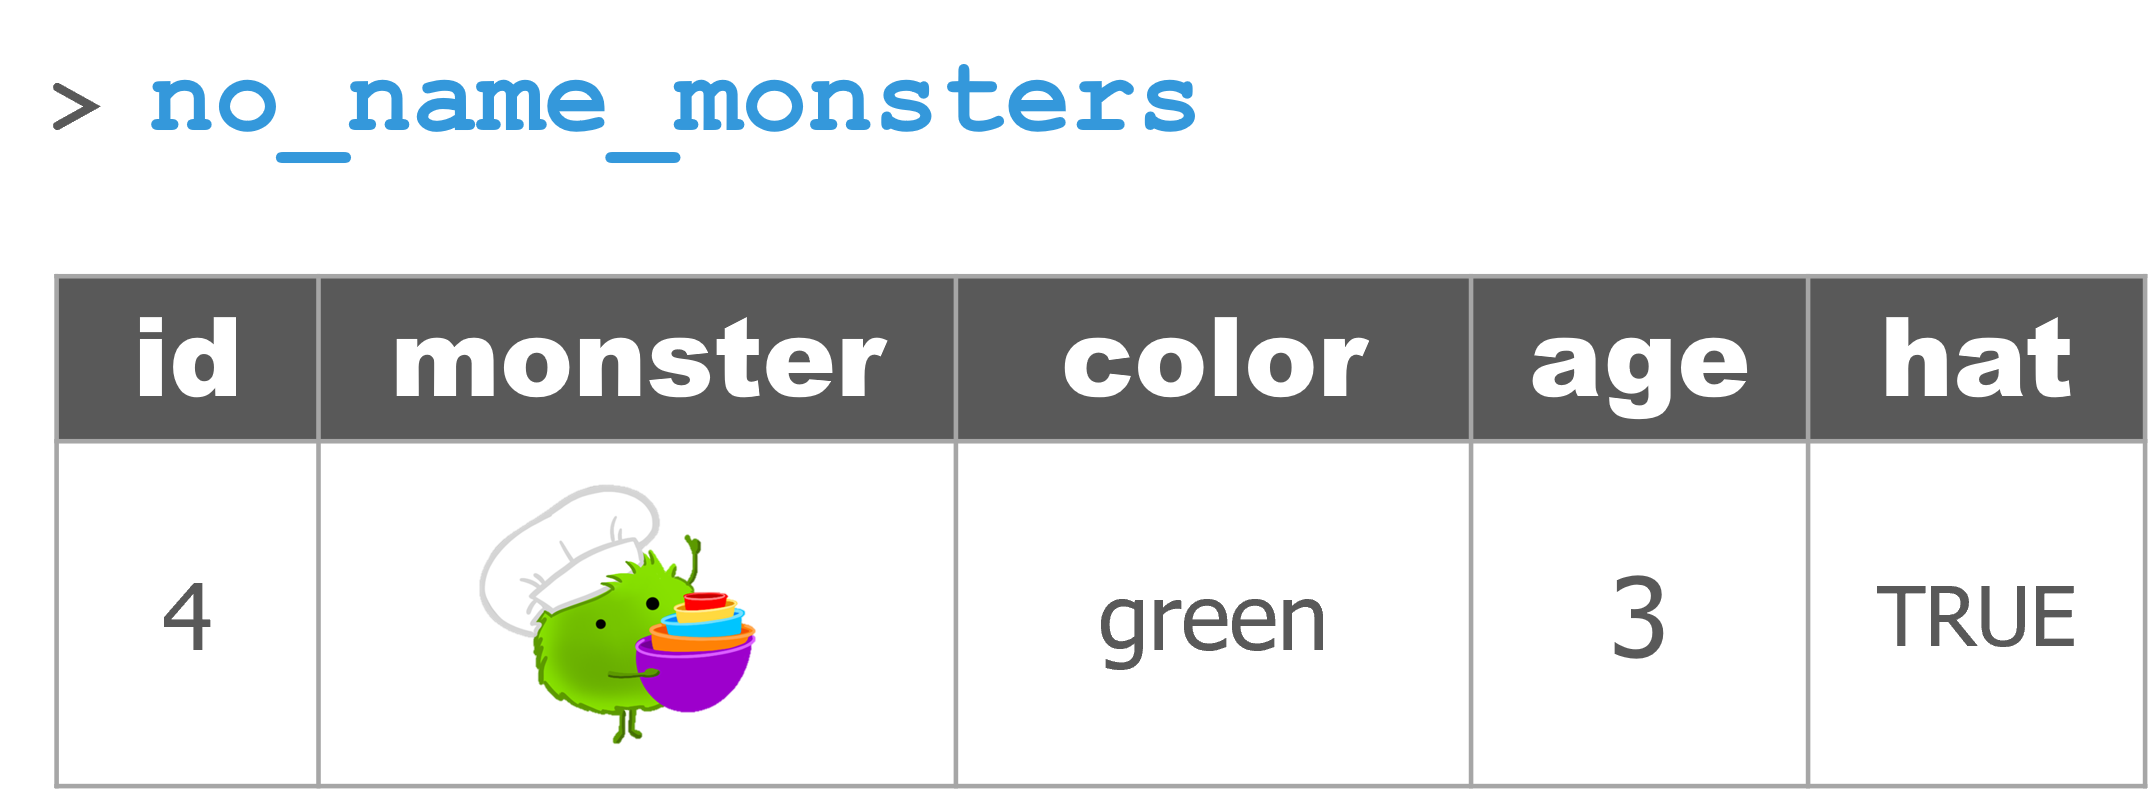
no_name_monsters <- anti_join(monsters, nicknames, by = "id")
# filter() alternative:
## monster id "NOT IN" nicknames id column
no_name_monsters <- filter(monsters, !id %in% nicknames$id)2 lubridate: Date and time travel

Dates with lubridate

It’s about time! Lubridate makes working with dates much easier.
We can find how much time has elapsed, add or subtract days, and find season and day of the week averages. The package is included in the tidyverse bundle of packages, so it’s already installed!
View the date cheatsheet. This is a great reference when you need to manipulate dates or timezones in your data.
Step 1: Become a date
Convert “text” to DATE
Does your date column look like something on the left? Here’s the lubridate function to convert the text column to a date.
| Format | Function to use |
|---|---|
| Month-Day-Year ~ “05-18-2023” or “05/18/2023” | mdy(date) |
| Day-Month-Year (Euro dates) ~ “18-05-2023” or “18/05/2023” | dmy() |
| Year-Month-Day (Science dates) ~ “2023-05-18” or “2023/05/18” | ymd() |
| Year-Month-Day Hour:Minutes:Seconds ~ “2023-05-18 8:35:22 AM” | ymd_hms() |
Real world dates
Month-Day-Year dates
| Format | Function to use |
|---|---|
| “05/18/2023 ” | mdy(date) |
| “May 18, 2023 ” | mdy(date) |
| “05/18/2023 8:00 CDT ” | mdy_hm(date, tz =“US/Central”) |
| “05/18/2023 11:05:32 GMT ” | mdy_hms(date, tz =“GMT”) |
European dates
| Format | Function to use |
|---|---|
| “18-05-2023” | dmy(date) |
| “18/05/2023” | dmy(date) |
| “18.05.2023” | dmy(date) |
No nonsense dates
| Format | Function to use |
|---|---|
| “20230518” | ymd(date, tz =“US/Central”) |
| “202305180630” | ymd_hm(date, tz =“US/Central”) |
Step 2: Sort your components

Date components (year, month, day)
| Function to use | Date component |
|---|---|
year(date) |
Year |
month() |
Month: 1, 2, 3; Use label=TRUE for Jan, Feb, Mar |
week() |
Week of the year |
day() |
Day of the month |
wday() |
Day of the week: 1, 2, 3; Use label=TRUE for Sun, Mon, Tue |
| - Time - | |
hour() |
Hour of the day (24hr) |
minute() |
Minutes |
second() |
Seconds |
tz() |
Time zone |
Step 3: Show your style
Monsters EVERYWHERE!

It seemed like a good idea to bring those helpful monsters along, and they’re so so cute. People hate to say it, but they are starting to become a real nuisance.
To get a grasp on the population explosion of monsters our research vessel is launching a full-scale monster survey. And they need our help.
Survey objective
- Organize the monster survey schedule.
- Starting May 2024, they would like to schedule a monster count once a week until October.
- They have enough volunteers to run the survey on two islands
DreamandBiscoe
So the survey goes from May until October. Let’s use the seq() (sequence) to generate the full list of dates during this time span.
How many days will the survey run?
Show answer
184 days
Let’s put the dates in a dataframe
You can create a dataframe with the functions
data.frame()ortibble().
1. Scheduling weekdays
Scientists on our boat are busy people. They only have one day per week when they can volunteer.
Here is the weekday when volunteers are available for each island:
- Dream:
Saturdays - Biscoe:
Tuesdays
When is the first Saturday in May of 2024?
For that, we can use the wday() (weekday) function.
Try changing some of the TRUE/FALSE values to see what the arguments are doing.
new_date <- ymd('2024-05-01')

# wday tells you the day of week (Sun, Mon, etc..) for a specific date
wday(new_date, label = TRUE, abbr = FALSE)
## [1] Wednesday
## 7 Levels: Sunday < Monday < Tuesday < Wednesday < Thursday < ... < SaturdaySo the 1st of May will be a Wednesday.
That means….May the 4th will be on Saturday. Perfect! That’s my favorite day.
Mutate to the rescue
We really don’t want to check every date one by one do we?
Let’s add a new week_day column to our survey table that checks ALL the dates ALL at once. To add a new column we call on mutate().
Complete the code below to add a week_day column to our survey table.
filter() week days
With filter we can pick out the days of the week that we want.
Split the schedule in two by filtering the survey to only the week day needed at each island:
Saturdayfor DreamTuesdayfor Biscoe
dream_dates <- filter(survey,  ______ ==  ________ )

biscoe_dates <- filter(survey, ______ ==  ________ )
Show code
How many survey dates will occur at each island?
Hint: It’s less than 50.
Show answer
26 survey days
2. Custom date formats
Oh no! Each survey island has been assigned a very-very particular Assistant to the Regional Manager. And they are demanding a very specific date format be used for their work schedules.
Before you send off the survey dates, you’ll need to adjust the dates to match the requested formats below.
Preferred date formats
- Dream:
08-18-2024 - Biscoe:
Aug 18, 2024
For the first case we will do things the more manual way and use format with specific date expressions to layout each piece of the date
Use format(count_date, ...) and the date expressions below to format the schedule for each region accordingly.
For example:
format(count_date, "%b, %Y")prints the date asMay, 2024.
%bstands for 3-letter month abbreviation%Y%stands for the full 4 digit year
Date parts
| Expression | Description | Example |
|---|---|---|
%Y |
Year (4 digit) | 2023 |
%y |
Year (2 digit) | 21 |
%B |
Month (full name) | December |
%b |
Month (abbreviated) | Dec |
%m |
Month (decimal number) | 12 |
%d |
Day of the month (decimal number) | 30 |
Time parts
| Expression | Description | Example |
|---|---|---|
%H |
Hour | 8 |
%M |
Minute | 13 |
%S |
Second | 35 |
Use mutate() to update the week_day column for the Dream island schedule.
Here’s a start
# Set date format to match 08-18-2024
dream_dates <- mutate(dream_dates, pretty_date = format(count_date, _______  ))
Show code
How’d we do?
| count_date | week_day | pretty_date |
|---|---|---|
| 2024-05-04 | Saturday | 05-04-2024 |
| 2024-05-11 | Saturday | 05-11-2024 |
| 2024-05-18 | Saturday | 05-18-2024 |
[Stamp] your dates
Now for stamp_date(). We’ll first create a stamp of our desired date format for Biscoe island, and then we will apply it to all the dates in our Biscoe schedule.
# Create date stamp with format of Aug 18, 2024
biscoe_stamp <- stamp_date("Aug 18, 2024")

# Test the stamp
test_date <- ymd("1985-10-26")

biscoe_stamp(test_date)
## [1] "Oct 26, 1985"Good to go! Use mutate() and the new stamp to update the week_day column for the Biscoe island schedules.
Here’s a start
# Set date format to match Aug 18, 2024
biscoe_dates <- mutate(biscoe_dates, pretty_date = ___________ )
Show code
How’d we do?
| count_date | week_day | pretty_date |
|---|---|---|
| 2024-05-07 | Tuesday | May 07, 2024 |
| 2024-05-14 | Tuesday | May 14, 2024 |
| 2024-05-21 | Tuesday | May 21, 2024 |
Congrats!
Your fine-tuned schedules worked perfectly. Now let’s jump ahead and take a look at the survey results.
3. Results
Load the monster survey results.
Explore a bit.
Are there any missing values?
A missing island
It looks like we have a slight missing data problem.
There’s a data point in the results that wasn’t labeled with the island location. We do know the date however.
On 2024-06-25 there were a whopping 7 monsters counted - but we just don’t know where.
Can you determine the island based on the date of the monster count?
Hint: What weekday is this?
Try the
wday(date)function.
Good sleuthing baking bot.
Right now we’re in a bit of a hurry, so let’s remove the row using filter.
Use filter() to keep only the rows in the survey data where island is NOT NA.
4. The best time for monsters
What is the best month to see monsters?
First, add a month column to the data with the function month() and the column count_date.
Next, use ggplot() and geom_col() to plot the monster sightings by month.
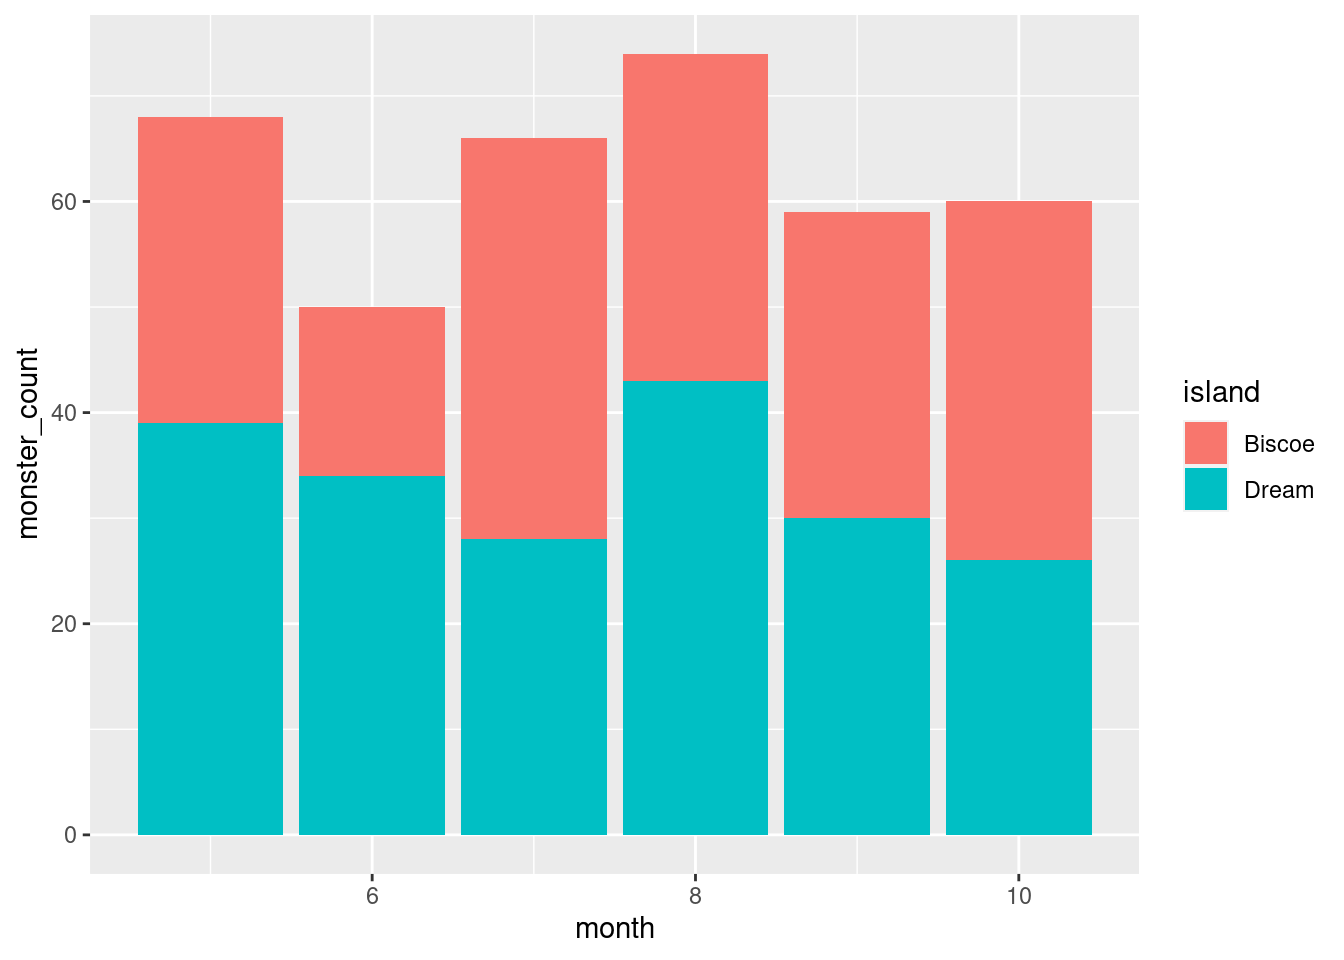
Why might June be the lowest month?
Hint: When was that data we dropped?
5. Time series: All the data
Plot all the data with geom_point(). Put count_date on the x-axis, and the monster_count on the y-axis. Set the color to match the island column.
Show code
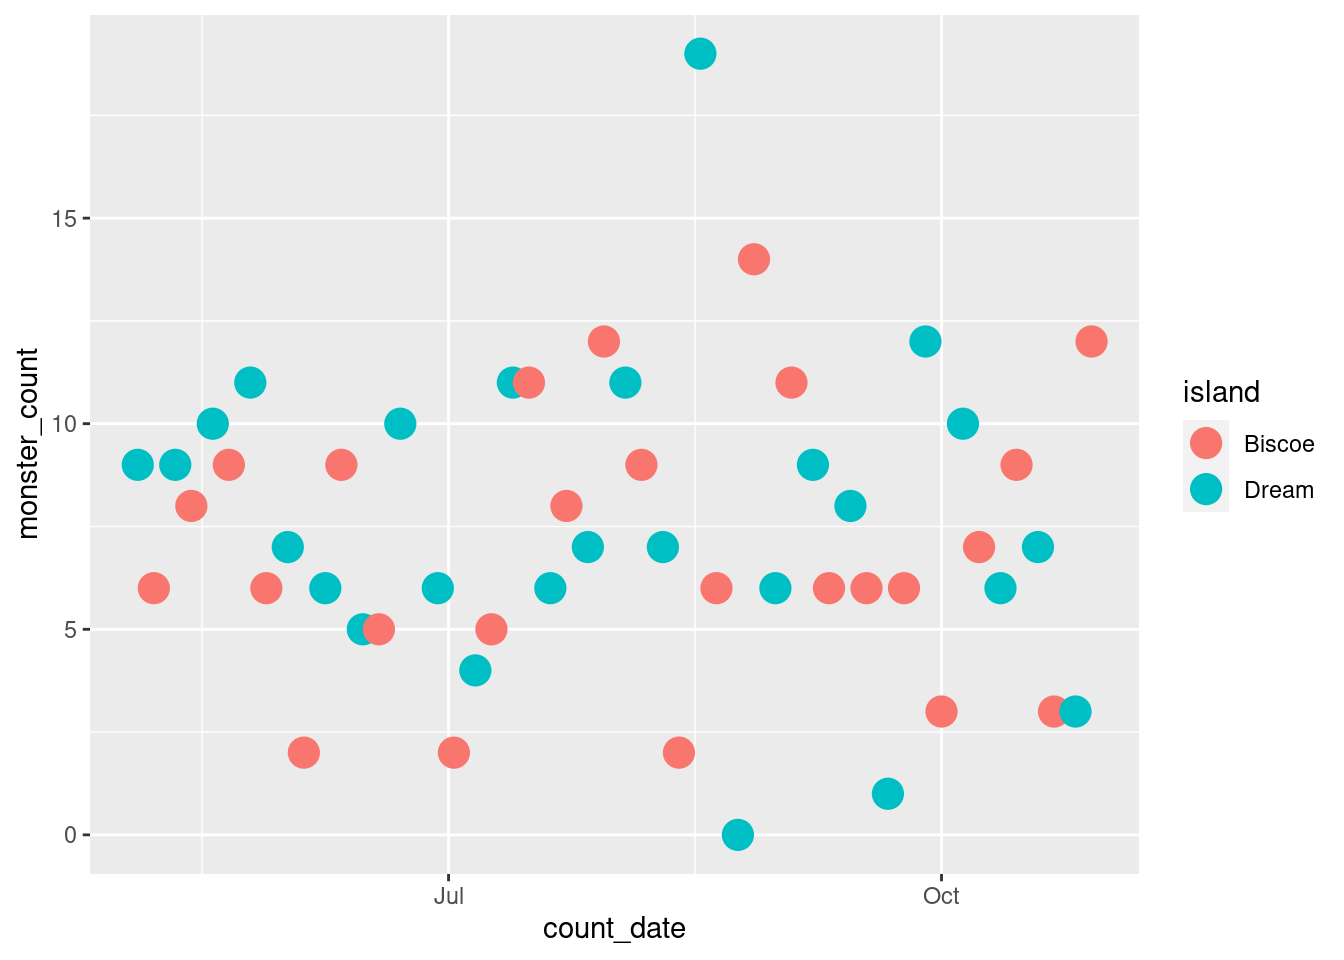
Oof! That’s a busy plot. Try adding + facet_wrap("island") to the end.
What happens? Then try adding + geom_line().
Show code
ggplot(monsters, aes(x = count_date, y = monster_count, color = island)) +
geom_point(size = 5) +
facet_wrap("island") +
geom_line()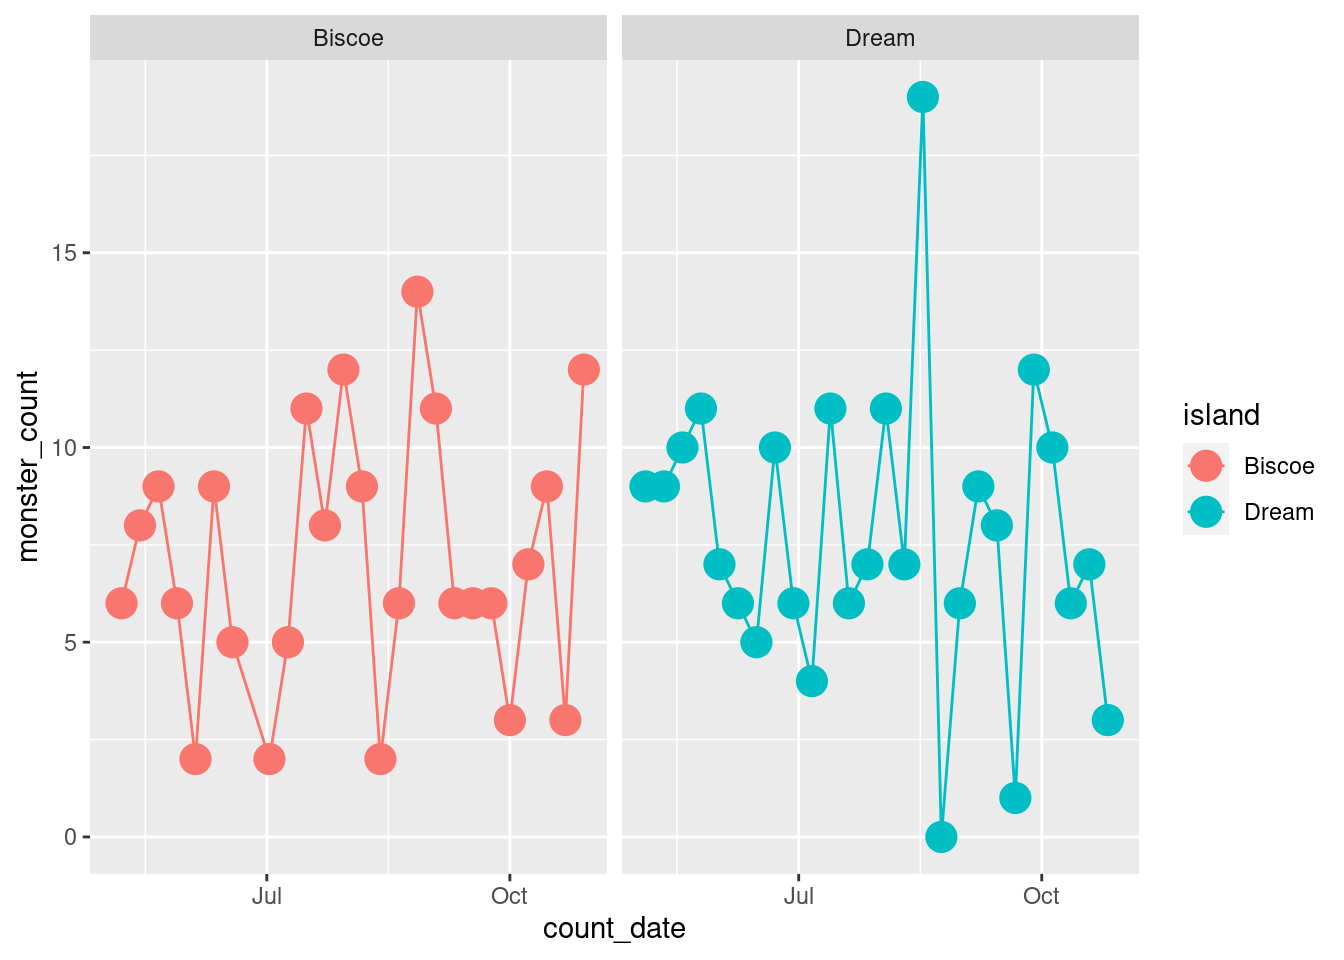
Great work
The researchers were deeply thankful and rewarded you with a shiny penguin magnet. They’ll be in touch for Monster Survey 2025.